Discover the mathematician within you with this simple problem
The power of multiple representations
I could never do music. I never learned to play an instrument, not a lick. I had no clue how a musical score is crafted. A music sheet was no more intelligible to me than a foreign language. So while I could appreciate classical music on a superficial level as a listener, understanding it was for other people.
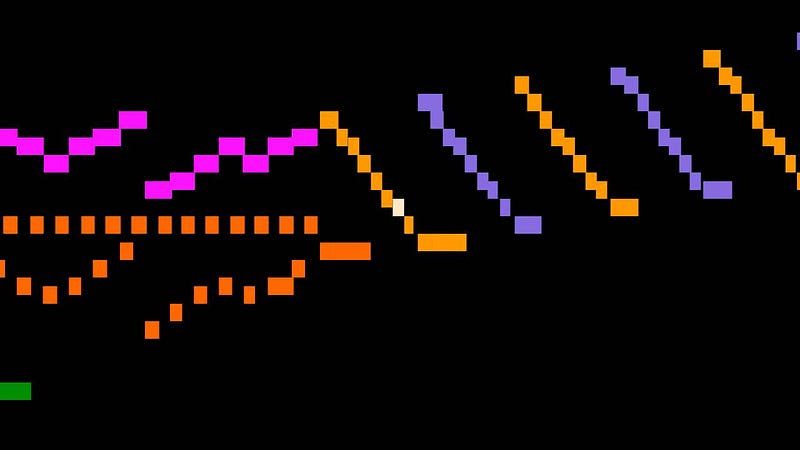
That all changed five years ago in grad school when a professor introduced us toMusic Animation Machine — Stephen Malinowski’s animated graphical score project. I watched with dumb-struck awe as the professor played a clip of Bach’s Toccata and Fugue in D minor. The piece was no different to usual, except that it was brought to life with the most intuitive of visualisations. I needed no training in obscure symbols or terms to make sense of Bach. The subtleties of pitch and rhythm were revealed with the simplest of coloured bar representations. I could identify and even anticipate recurring patterns. I heard notes that had previously eluded me.

Bach as you’ve never seen him
In that moment, a new thought took hold of me. A deep understanding of music was within my grasp after all. A virtuoso I was not, but for the first time in my life, I was able to truly connect with classical music. It had only taken twenty-seven years, and an inspired presentation that defied everything I had been taught about music at school.
We need to do for maths what Stepehen Malinowski has done for classical music — place it within the reach of everyone, and especially those who have long given up on connecting with the beauty and elegance of the subject; even its simplicity.
Take the following problem, inspired byJames Tanton’s “Math without words” project:
Sum the first 100 odd integers.
No biggie — anyone and their calculator can knock this out with dogged effort. But that’s ninety-nine separate calculations; life’s too short for this brand of mathematics.
You may be tempted to impose theformula for summing an arithmetic series. But that hardly seems satisfying (and, after all, the formula did not just spring into being).
Let’s instead sum the first few terms, just to see what happens. However flaky it may seem, that strategy is perfectly natural to mathematicians. The key is to keep an open mind and to stay alert to any patterns. So:
1
1+3 = 4
1+ 3+ 5 = 9
1+ 3 + 5+ 7 = 16
Notice anything? The resulting values — 1,4,9,16 — may seem familiar. You will recall that they are the square numbers.
Hold up. We were just adding odd numbers — who invited squares to the party? Well, here they are. And we must now ask the question pursed on the lips of every mathematician.
Why?
Why does adding odd integers give us squares? Let’s find out. We can stare long and hard at the symbols above, but inspiration may not come unless we change the representation. Well, there’s a reason we call them square numbers — these values correspond to areas of squares! So
1 = 1 x 1
4 = 2 x 2
9 = 3 x 3
16= 4 x 4
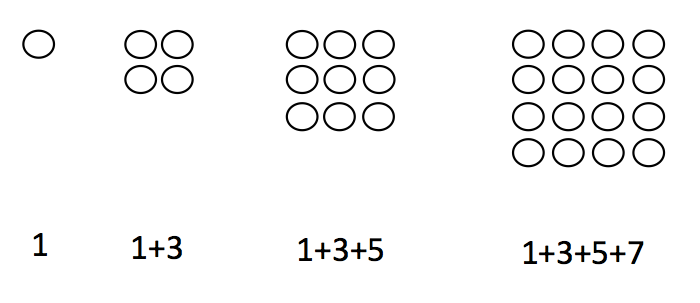
and so on. That’s good, because we can now visualise this pattern to see what’s going on. We can draw the squares.

We can now literally see that summing the odd integers results in squares. The link between odds and squares is slowly revealing itself through this pictorial representation. You can sense the connection; why adding the next odd number gives the next square along. Perhaps you can’t quite put your finger on it.
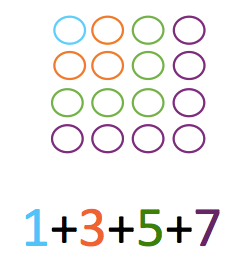
So let’s go again, this time using a different colour in each step.

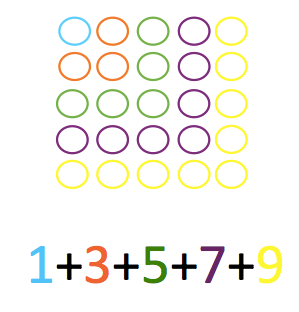
Amazing what a bit of colour can do, right? The connection is now clear — adding an odd integer corresponds to the next ‘layer’ of the square; that reverse L-shape. To get the next square along, we would need 5 along the bottom row, and a further four along the right-hand column, i.e. a total of 9 more spots.

So summing the first odd integers is no more and no less than the area of a 100x100 square. It’s ten thousand. But the answer is a mere side note to this problem. Consider what just happened — we started off with an arithmetic sum, represented by symbols on a page. We explored, we probed and we found a geometrical connection. We visualised the problem and saw the link for ourselves. We uncovered the geometry of odd numbers — we linked maths topics that are typically separated in the curriculum.
In short, we became mathematicians.
The lesson for educators — and the point of that graduate class — is to use multiple, diverse representations when presenting mathematical concepts.
Only a small minority of students will grasp the syntactic form of school maths. That does not make them any less capable; the limitation is one of curriculum and pedagogy.
As educators we are responsible for building as many entry points to understanding and engagement as we can. Visualisation alone is not a silver bullet; to understand and solve our problem, we needed to call on our core knowledge of odd numbers, basic addition and squares. But pictorial representation is a vital problem solving heuristic — mathematicians routinely translate abstract-sounding problems into visual ones. Visualisation is an equally vital — and engaging — way for students to undertake problem solving.
Mathematical thinking lies not in brute force calculation, but in shifting representations and finding connections. I hope this example persuades you (if you needed persuading) that a mathematician resides within you.
And with that, I invite you to explore this intriguing sum:
1 + 2 + 3 + … + 98 + 99 + 100 + 99 + 98 + 97 + … + 3 + 2 + 1
Enjoy.
No comments:
Post a Comment